|
DYNAMOMETER |
|
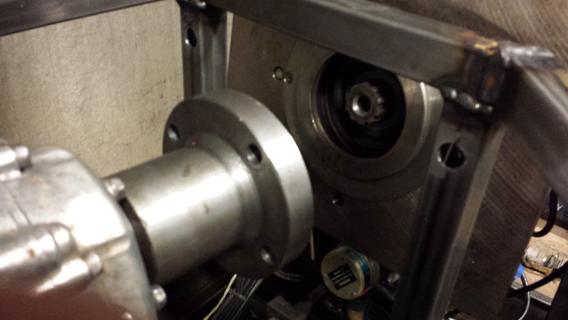
Analysis and Design †††††††††††† The engine stand was designed to not deform with the stock engine loading applied to it so that the engine could be run on the dyno with the restrictor in place and data could be collected. This stand was designed so that the engine will be easy to remove from the stand with two people. It also simulates a bell housing and allows the engine to be bolted up to the dynamometer in the way that the standard V8 was originally bolted up, preventing the engine from causing unwanted vibration due to misalignment. This also allows for the deletion of the PTO shaft which was previously used to couple small motors to the dynamometer, with the deletion of the PTO shaft the engine can be tested throughout its full operating range without being in danger of causing destructive damage to any of the parts in the dynamometer.
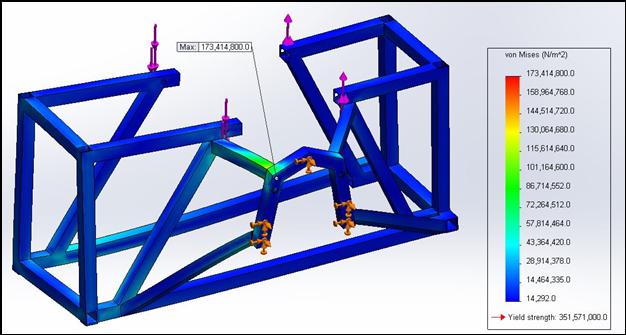
The above image shows the FEA on the engine stand. On the engine stand the largest stress concentration was at a joint between 2 pieces of square steel tubing and on the final model it has been fully welded, so the real engine stand is predicted to have an even lower maximum von Mises stress. After analyzing this design it was decided to build the final version and attach the engine to the dynamometer.
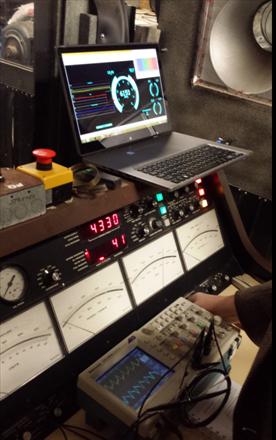
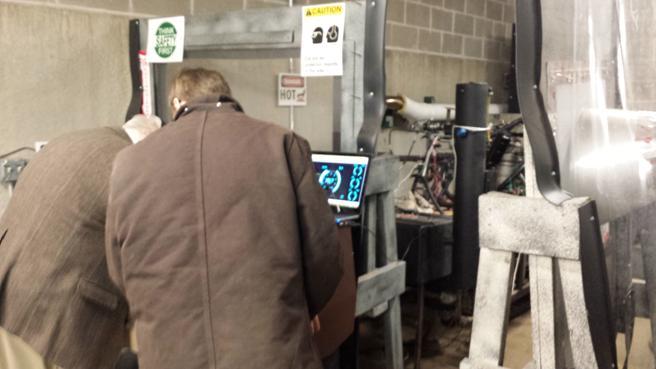
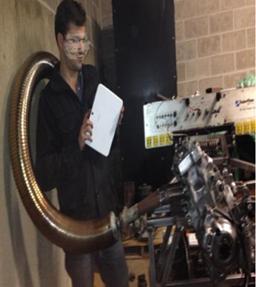
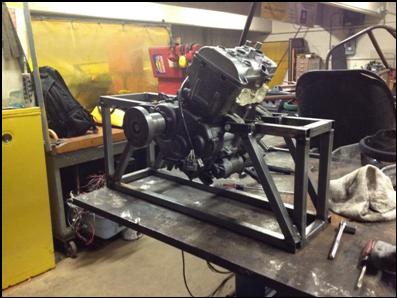
Engine attached to engine stand before welding in the bell housing assembly. †††††††††††† After the installation of the engine to the dynamometer, the engine was wired up to run and started on the dynamometer stand with the help of software filtering on the crankshaft position sensor, we were able to find a shunt resistor that minimized the noise seen by the engine and allowed us to rev the engine fully without losing synchronization between the camshaft and the crankshaft sensor. †††††††††††† To run the engine on the dyno the dynamometer was fully serviced, the pumps were checked out and the load cell was calibrated. This allowed for the engine to finally be started and run through itís operating range with a test intake consisting of only a Y pipe and a 20mm restrictor. The first dynamometer runs proved to be too much for the cooling system, as the engine will not see wide open throttle for more than a fraction of a minute, whereas we were running the engine for 2 minutes at wide open throttle, so the cooling tower was attached to the dynamometer to aid in cooling the engine for extensive testing. †††††††††††† After the engine was able to operate smoothly for extended periods of time torque data was collected by hand by loading the engine and increasing the rpm to find the maximum load at each specific rpm. It was decided that this method was unacceptable for long term data collection so a Labview virtual instrument was made for an NI-Mydaq data acquisition system and it was connected to both the speed and torque pins inside of the CPU of the dynamometer. The data acquisition software was then also connected to a digital pin on the CPU that goes high when the CPU on the dynamometer was originally intended to record data, this allows us to take data points by using the auto-test feature of the dynamometer.
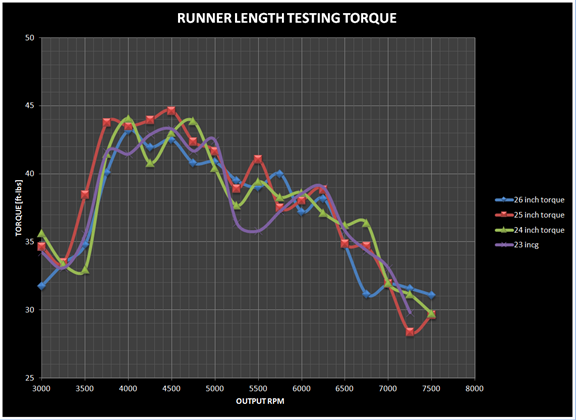
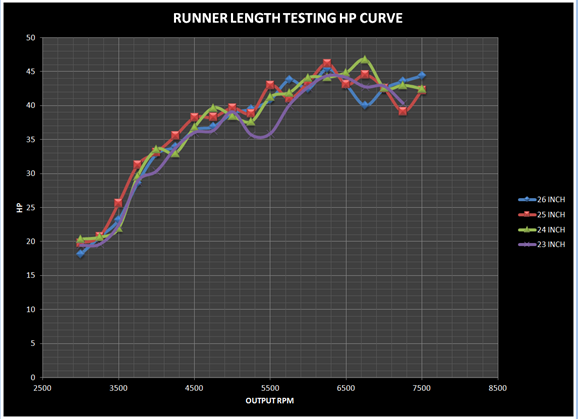
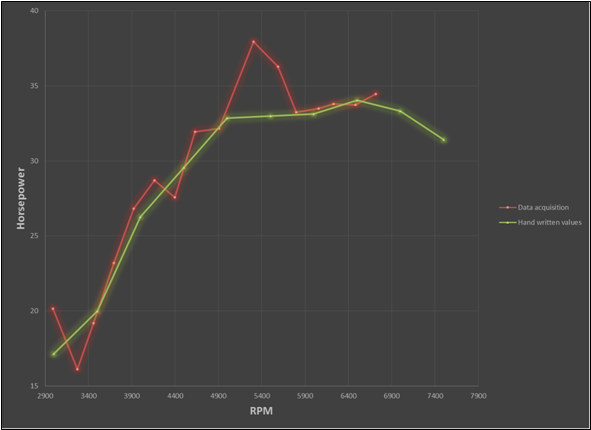
Graph of horsepower vs RPM †††††††††††† The above graph shows a representation of the data acquired by hand as compared to the data acquired by the data acquisition system. There are slight differences in the horsepower between the two methods of taking data, but it was determined that the acceleration test on the dynamometer is more realistic because the engine will not be allowed to run a steady rpm for an extended period of time at the competition. Both methods produced repeatable results, so the data acquisition method will be used for dynamometer testing, and a slower acceleration test will be done to validate the final design of the intake. |
